
A call center is not managed by guessing or applying magical formulas, but by consistently monitoring and analyzing its indicators: those vital metrics that determine the health of the business. And prioritizing them is a more complex task than it seems.
There are indispensable KPIs, such as the number of calls, peak hours, or wait times. Because if every Monday at 9:00 you receive 150 calls, you need to properly size your team of agents.
The indicators that measure the delicate balance between customer service quality and the cost of operations, such as FCR or AHT, would definitely be next on the list.
And after covering the basics, we would still have dozens of crucial metrics, such as NPS, service level, abandonment rate, unproductive time, or turnover.
In the end, in a call center, every call—made, answered, or missed—counts.
In this guide, we will tell you about the most important indicators and how conversational AI can help you optimize them. So, if you want to ensure quality standards while keeping costs in check, keep reading.
The Importance of KPIs in the Call Center
We have selected the 29 indicators that we consider most relevant for the management of a contact center, from its operations to the monitoring of productivity or quality.
That doesn’t mean you should measure them all. In fact, the best answer to the question, “which indicators should you measure?” is… it depends. You should always ensure that KPIs are aligned with the requirements of the business.
Before we dive in, let’s quickly take a look at the peculiarities of indicators in the call center sector.
The Basics: What are KPIs?
KPIs, Key Performance Indicators
KPIs are metrics that allow you to evaluate the performance of a company, business unit, department, team, or employee. They can also be used to measure the performance of a project, strategy, tactic, or action.
Regardless of the scale at which they are applied, the important thing about indicators is what they show: whether or not progress is being made in the right direction.
You can think of business objectives as a compass pointing north, and KPIs as indications on a map; the roadmap that marks the key points to reach the final destination.
And what about KPIs in a call center?
They serve the same purpose: helping to evaluate performance and make decisions. However, in the call center industry, indicators take on a dramatic significance because decision-makers face two specific challenges.
Challenge #1: Reducing Uncertainty
Seasonal peaks, hourly variations, and the situational nature of calls make it difficult to estimate the volume of work that will enter the contact center.
You are entirely dependent on customer demand, which complicates planning and properly sizing the team of agents.
To reduce this uncertainty as much as possible, you need to know your call curve. And that is precisely what measuring KPIs such as absenteeism rate, peak calls, or abandonment rate achieves.
Challenge #2: Costs vs Quality
There is a constant struggle between two forces inherent in the nature of the call center: reducing costs and increasing customer service quality.
At first glance, they may seem contradictory, but it is essential to find a balance.
In an outsourced contact center, you are charged for calls answered. That is, there is a direct link between management and productivity indicators and billing.
Each call answered represents revenue but also a cost. If you miss calls, you lose money, so you have to add the cost of missed opportunities to the actual cost of the calls.
In a tight-margin industry, the impact of small, scalable improvements in productivity, efficiency, and quality can be enormous.
Customer satisfaction and experience come first, but costs and revenues are always there, impossible to forget.
It’s a delicate balance that must be struck, trying to answer the maximum possible number of calls, provide good service, determine the precise number of agents needed for this, and all within an average time frame.
Inbound Indicators vs Outbound Indicators
Indicators tell us how things are going in all areas relevant to the business. That’s why we have indicators that talk about productivity, operating costs, service quality, or customer experience.
All of these are measurable criteria, but some are more qualitative in nature than quantitative. In other words: some KPIs speak more to the quality of the calls, while others focus on the quantity.
In inbound call centers, more qualitative indicators are taken into account, while in the case of outbound indicators, the quantitative aspect carries more weight. We will now see why.
Inbound Indicators
Inbound indicators: indicators used to measure performance in a call center that handles inbound calls, meaning calls for inquiries or issues that come in and are attended to by agents.
Sales calls may come in, but generally, inbound call centers are dedicated to customer service, providing information and technical support.
This function is what makes a large part of the inbound indicators focused on quality criteria, such as customer satisfaction. However, management KPIs aimed at reducing uncertainty are also crucial for their survival.
Outbound Indicators
Outbound indicators: used to measure the efficiency of an outbound call center, where agents usually carry out telesales activities.
These are typically call centers where outbound marketing and outbound sales campaigns are executed, with the aim of acquiring leads or customers.
That’s why the most relevant outbound indicators lean more towards the quantitative side and short-term sales, such as the number of calls made. It makes sense when considering that there is no surprise factor, as there is in an inbound scenario.
Apart from the most direct KPIs, such as the number of calls, leads, or sales, outbound indicators aim to provide information on conversion rates, utilization, or the qualification of databases.
29 Key Call Center Indicators
The first 20 KPIs on this list are primarily inbound indicators, and the last 9 are purely outbound. However, many of them are used in all types of contact centers (in & out).
👁🗨 Don’t miss the summary at the end of each indicator, where you can see if it is a 100% inbound indicator or an ambivalent one, and the formula for calculating it (if it has one).
Inbound KPIs
Within inbound indicators, there are three main groups: Customer Experience and Quality KPIs, Productivity KPIs, and Management and Operations Cost KPIs.
As we already mentioned, although all of them are quantitative, they tend to speak to quality criteria, especially the KPIs in the customer experience area. Let’s see what each of these metrics measures.
Quality and Customer Experience KPIs
1. Customer Satisfaction
Customer Satisfaction variations: Customer Satisfaction (CSAT)
CSAT measures the level of customer satisfaction through a survey in which customers are asked how satisfied they are with the interaction they just had with the agent.
Possible responses are organized on a scale from 1 to 5, where 1 is “not at all satisfied” and 5 is “very satisfied.”
Today, it’s not enough to satisfy customers; now you must delight them, making this an indispensable indicator for any contact center.
☑️ 100% inbound indicator
2. Abandonment Rate
Abandonment Rate variations: call abandonment percentage, Call Abandon Rate, Abandon Rate (AR)
The abandonment rate measures the percentage of unattended calls, meaning when the customer or consumer hangs up the phone before getting to speak with an agent.
Seen in isolation, the abandonment rate is a KPI that doesn’t say too much. However, it has a significant impact on KPIs related to customer satisfaction and experience and provides valuable information on productivity and operation logistics.
For example, if the average call abandonment rate is too high, it is very likely that some process or technical management is not working.
The abandonment rate is also directly related to the average response time and average waiting time, skyrocketing when either of these two is too long.
🧮 Formula: Abandonment Rate = (Total abandoned calls / Total incoming calls) * 100
☑️ 100% inbound indicator
3. Net Promoter Score (NPS)
The NPS is a relatively recent KPI, but its popularity has grown significantly in recent years, following the article published by Frederick F. Reichheld in the Harvard Business Review: The One Number You Need to Grow.
It measures your customers’ loyalty and predicts the likelihood of them recommending you. To do this, the NPS requires directly asking the customer about their intention:
“How likely are you to recommend [product, service, brand] to a friend?”
Responses are measured on a scale of 1 to 10, where 0 is “not likely at all” and 10 is “extremely likely.”
Those who respond with a value between 0 and 6 are classified as “detractors,” with a 7 or 8 as “passives,” and with a 9 or 10 as “promoters.” Only the latter, the promoters, are considered loyal customers willing to recommend you.
☑️ 100% inbound indicator
4. Customer Effort Score
Customer Effort Score variations: CES or Customer Effort Score
The Customer Effort Score is also a fairly recent customer service KPI that measures the effort a user puts into resolving their question or issue during the call with the agent.
In a nutshell: how easy you make it for your customers.
This indicator is measured through satisfaction surveys, including questions at the end of the communication like this one:
“Please indicate to what extent you agree or disagree with the following statement: It was easy to resolve my issue.”
Customers are given the option to answer on a scale of 1 to 7, with 1 being “very difficult” and 7 being “very easy.” The score will be the Customer Effort Score, which is typically measured individually.
☑️ 100% inbound indicator
5. Customer Retention Rate
Customer Retention Rate variations: CRR, customer retention rate, or retention rate
This measures the percentage of customers that the company has retained; that is, how many customers have remained loyal during a specific period of time.
To measure the retention rate, you need to take into account 3 factors:
- Number of customers at the beginning of the period (x)
- Number of customers at the end of the period (y)
- Number of new customers acquired during that period (z)
🧮 Formula: retention rate = [(y-z) / x] * 100
☑️ 100% inbound indicator
6. Churn
Churn variations: Customer Churn Rate, CRR, churn rate, attrition rate, or cancellation rate
Churn or customer attrition measures the percentage of users who cancel a contract or stop using the company’s services during a specific period. It could be said that it is the opposite metric to the retention rate.
🧮 Formula: Churn = (Customers lost in a time period / Customers at the beginning of the period) * 100
☑️ 100% inbound indicator
KPIs for call center productivity and efficiency
7. Service level
The service level is one of those essential productivity KPIs because, among other things, it helps to properly size the call center.
It measures the percentage of calls answered within a specific time period (typically 20 seconds) and is used to determine if agents are moving quickly enough from one call to the next.
🧮 Formula: Service level = (Number of calls answered within the time frame / total number of incoming calls) * 100
☑️ 100% inbound indicator
8. FCR
FCR variations: First Contact Resolution, First Call Resolution, resolution on the first call, or resolution on the first contact
FCR measures the percentage of cases or issues resolved on the first call.
It is undoubtedly one of the two most relevant inbound indicators, which are always measured in any call center because it simultaneously addresses those two essential dimensions: customer service quality and the cost of the operation.
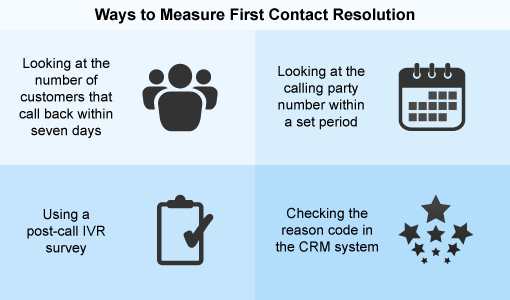
A good FCR is one of the clearest indicators of customer satisfaction and influences the reduction of call center costs: a sign that there is a good balance between those two difficult-to-balance forces.
It is very similar to the KPI “repeat calls”; or rather, it indicates the same thing and solves the same problem but measures the opposite data (how many customers call more than once to resolve their issue).
🧮 Formula: FCR = (Cases resolved on the first call / Total cases) * 100
☑️ Inbound indicator
☑️ Outbound indicator
9. AHT
AHT variations: Average Handle Time, Average Handling Time, Average Operation Time, AOT
AHT measures the average time of interactions with customers and, along with FCR, is probably the most important inbound indicator of a contact center.
Like FCR, it is a KPI that is monitored with the intention of balancing costs with a quality customer experience.
Agents develop different levels of product knowledge depending on the time they have been working with a campaign or client. From our experience, this is a critical point that contributes to the reduction of AHT and, consequently, to the reduction of costs and the success of the call center.
We give you an example of a project in which we analyzed more than 27K calls for an automotive company. After the analysis, the inefficiencies that were causing an increase in AOT became evident and could be addressed executively.
By resolving unjustified silences, excessively technical conversations, or the lack of knowledge of some agents, we managed to improve AHT by 8%, which resulted in savings of 80,000 € per year.
🧮 Fórmula: AHT = [(Talk time + hold time + after-call time) / total number of calls] * 100
☑️ Inbound indicator
☑️ Outbound indicator
10. First Response Time
First Response Time variations: FRT or Average First Response Time
FRT measures the average time taken by call center agents to respond for the first time to a support ticket, an issue, or a customer inquiry.
It is a very similar metric to Average Speed to Answer (ASA) or response time, which measures the average time it takes for an incoming call to be answered, including the customer’s waiting time until an agent attends to them for the first time.
Both FRT and ASA are closely related to the abandonment rate and customer satisfaction.
🧮 Formula: FRT = (Total time spent on sending first responses / Number of tickets that received a first response) * 100
☑️ Inbound indicator
☑️ Outbound indicator
11. Case Volume
Case Volume variations: Call Volume
Case Volume is an indicator similar to the service level, but more focused on individual productivity.
It measures the number of calls an agent receives within a specific period of time, and a daily minimum quota is usually set to maximize the number of cases that can be attended to by the operator.
🧮 Formula: Case Volume = Total number of calls attended by the agent within the time period
☑️ Inbound indicator
12. After Call Work Time
Variations: After Call Work (ACW)
When an agent finishes a conversation, they always have management and organization tasks ahead of them: updating contact information, sending the customer emails with offers, conditions, relevant information, etc.
During this time, the agent is not available to take another call, so monitoring this after-call work time is crucial for reviewing the efficiency of the work systems.
🧮 Formula: After Call Work Time = (Total time spent after calls / Total number of calls)
☑️ Inbound indicator
☑️ Outbound indicator
13. Call Resolution Rate
Variations of Call Resolution Rate: success rate, completed call rate, Call Completion Rate (CCR)
The call resolution rate is an indicator that reflects the proportion of successfully resolved calls or completed tickets in relation to the number of failed calls or tickets.
Metrics associated with the “success” of a call can vary depending on the call center. However, in general, we can say that they always involve a requirement: that the call does not need to be repeated.
In this sense, the call resolution rate is very similar to FCR or first call resolution. It is a KPI that tries to keep the same problem under control.
In its outbound dimension, the concept of “failed call” included in this indicator usually includes the number of invalid phone numbers and unanswered or hung up calls by the customer.
It is usually measured in relation to a time frame, such as an hour or a day. For example, 70% of completed calls per day.
🧮 Formula: Call Resolution Rate = (Total resolved calls / Total calls) * 100
☑️ Inbound indicator
☑️ Outbound indicator
14. Unproductive time
Variations of idle time: idle time, available time, or avail time
Idle time is the time that agents in a contact center spend inactive: without answering calls or performing After Call Work tasks, usually waiting for the next call to come in.
This number should be as low as possible, but it is unrealistic to expect that idle time is equal to 0, as there is no absolute productivity of 100%.
On the one hand, net and gross hours must be considered, which include different factors such as absenteeism, lost hours, visual rest time, etc.
But on the other hand, within the net working time – the time the agent is connected – other aspects must be considered, as there are always minimum times for opening or closing programs, etc.
In the end, out of every 60 minutes an agent works, only about 45 are considered productive, due to visual breaks according to the agreement, administrative tasks, and other dead times.
And that’s in a call center where an incessant flow of calls comes in; if we talk about back-office tasks, idle time increases considerably.
☑️ Inbound indicator
☑️ Outbound indicator
KPIs for management and cost of operations
15. Peak Hour Traffic (PHT)
Peak Hour Traffic indicates the time of day when the highest volume of calls is received, for example, at 9 in the morning, 4 in the afternoon, etc.
It is a crucial indicator for call center sizing. In fact, it largely determines work shifts and the duration of workdays (4, 6, or 8-hour contracts).
☑️ 100% inbound indicator
16. Time lost due to technical problems
Variations of time lost due to technical problems: hours lost due to technical issues, time wasted due to technical difficulties
This indicator measures all the time lost due to technical problems, such as system failures, network outages, or issues with any technology necessary for the agents to perform their work.
It is expressed as a unit of time (usually 1 hour) measured monthly, biweekly, or weekly, depending on the incidence of technical problems.
☑️ Inbound indicator
☑️ Outbound indicator
17. Average Wait Time
Variations of average wait time: hold time
“All our operators are busy. Please wait…”
Those who call a contact center expect to be assisted immediately, to the point that there is a whole community (On Hold With) created with the sole purpose of reducing wait times or even ending them… forever.
It may seem exaggerated, but wait times have a huge impact on the customer experience, satisfaction, and loyalty.
When the average wait time is too high:
- It negatively predisposes the customer, increasing their frustration and making it harder to solve the ticket quickly and satisfactorily.
- It directly affects the abandonment rate, which affects the company’s image and its ability to retain and/or acquire customers.
In addition, wait time reveals other vital signals to efficiently manage the operation and may point to sizing problems during certain periods of time, such as the summer period.
And if you don’t believe it, just ask Jeff Bezos, who once asked about wait times in the middle of a meeting. Bill Price – former Vice President of Customer Service – replied “one minute”. But Bezos dialed the phone himself to check and…
After four endless minutes, the anecdote ends with Amazon’s owner totally enraged, hanging up and throwing the phone.
🧮 Formula: Average Wait Time = (Total wait time for calls / Number of answered calls) * 100
☑️ Inbound indicator
☑️ Outbound indicator
18. Absenteeism rate
Variations of the absenteeism rate: absenteeism index or absenteeism rate
This index measures the impact of agent absenteeism, that is, unjustified absences, sick leave (whether justified or not), and delays.
It directly affects costs and indirectly affects other productivity and customer experience KPIs, as well as negatively influencing the work environment and well-being of other agents (those who are not absent).
🧮 Formula: Absenteeism rate = (Number of absent hours / Total number of worked hours) * 100
☑️ Inbound indicator
☑️ Outbound indicator
19. Agent satisfaction level
Variations of agent satisfaction level: Agent Satisfaction Score or Agent Happiness Score
The agent satisfaction level is a cross-cutting indicator that impacts other fundamental KPIs such as the level of service, customer satisfaction, or labor absenteeism.
Indicators that reflect employee well-being, such as the satisfaction level or turnover rate, have gained strength in recent years, and more and more companies are investing in the professional development of their employees.
It can be measured qualitatively, through individual meetings, or quantitatively, with satisfaction surveys similar to those used for customer satisfaction but directed towards employees, as an internal customer.
☑️ Inbound indicator
☑️ Outbound indicator
20. Agent turnover
Variations of agent turnover: staff turnover rate, attrition rate or turnover
The contact center sector has experienced high turnover rates in the last decade due to the lack of specialization and the instability of working hours.
It is a heavily measured, penalized and pressured industry. And when you are paid per call answered, the departure of trained agents can threaten your margin, so keeping turnover under control is a challenge that is very specific to the sector.
In fact, it is common for even the end client to penalize an increase in this indicator, assuming that the entry of new agents affects other key metrics, such as AHT or satisfaction.
To keep this KPI under control, there are loyalty mechanisms such as internal promotions, campaign changes, etc. Additionally, it is common for project managers to have turnover rate as one of their objectives.
🧮 Formula: Turnover rate = (New agents entering / Agents leaving the company) * 100
☑️ Inbound indicator
☑️ Outbound indicator
Outbound indicators
We have previously seen mainly inbound or ambivalent indicators. However, specific KPIs related to the use of the database are also used in outbound call centers.
Here is a summary of the most important ones.
21. Number of calls made
This is the first of the outbound indicators for a good reason: it measures the sales team’s adequacy to the campaign and the agents’ productivity, which is essential for call center sizing.
It can be measured by agent, hour, customer account, or campaign.
22. Connection Rate
The Connection Rate, also known as Answer Success Rate, shows the relationship between calls made and answered.
It is a very simple efficiency indicator that can be measured daily by simply dividing the number of answered calls by the total number of calls dialed.
23. Average call time
This KPI measures the time agents spend on the phone. A very high or very low average call time may indicate a lack of adequacy in the sales speech.
It also serves to determine if agents are adhering to the script or if they have the necessary knowledge to close the sale.
24. Number of processed leads
The number of processed leads is a metric similar to the number of calls made, but in this case, the focus is more on efficiency than productivity.
Proper lead qualification comes into play here because each call ends with a possible outcome: the customer is interested in buying or not, or has already bought, or perhaps the phone number is incorrect and therefore an invalid contact.
At that moment, the agent must classify the call correctly and qualify the contact to improve the effectiveness of the sales team.
For example, imagine a utilities campaign in which a product for electricity and gas is offered, and the customer responds that they do not have gas. The agent then has two options:
- Classify and qualify the contact
- Mark the contact as a non-sale
The first case opens the possibility of contacting the lead or customer later and offering them a product adapted to their needs.
The second case is more serious than it seems: not only does it cancel the option to close the sale at another time, but it burns the customer and hinders the work of other agents who can call the contact and insist on the offer for a prolonged period of time.
25. Conversion Rate
The conversion rate is the percentage of calls in which the objective has been achieved, whether it is scheduling an appointment for advice or a demo, closing new sales, customer participation in surveys, or customer loyalty programs.
26. Database effectiveness
Obtaining a database costs money. A lot. And if the leads are very cold, or worse, burned, there is little room for work. That is why monitoring the qualification of leads is essential.
Database effectiveness is an indicator that seeks to detect that quality, pointing out the adequacy of the contacts on the list.
If agents qualify contacts after making the call, the effectiveness of the database can be improved with the aim of taking advantage of it in future campaigns.
27. Sales
This indicator can be measured in different dimensions: sales per hour, sales per agent, sales per campaign, etc. But it is important to measure not only the close, but also to contrast this KPI with some metric that points to the quality of the sale.
Because misleading the customer to sell quickly and poorly some advantages that do not fit the reality of the product is a path that leads nowhere but to complaints or even legal penalties.
That is why verification of outbound call center sales is so important to detect incorrect practices, rectify or redirect those sales, and take necessary measures to prevent future incidents.
28. Earning per successful call
Here we would be talking about the average purchase ticket, measurable by both agent and database or campaign.
It’s not just about closing the sale, but maximizing revenue through cross-selling or up-selling strategies and other types of offers, promotions, and discounts.
29. Cost per call
Cost per call, or CPC, reflects the relationship between operating costs and the volume of calls made in a given period of time.
Here it is necessary to take into account all the specific costs that are involved in the total operational cost (salary expenses, software, equipment, administration, etc.). It is a daunting task, but essential to understand the profitability of the call center.
Measuring call center key performance indicators with conversational AI

Billing models based on answered calls and penalties for missed sales impose the wild search for a precise point: lower costs, higher revenues.
And considering the impact of measurement, all contact centers have a quality department that manually audits calls, usually with the help of speech analytics-based technologies.
But standard SA solutions and manual listening offer a partial, biased, and slow-motion view.
That’s where artificial intelligence comes in, which represents a paradigm shift in KPI measurement.
AI-based technology allows for complete, scalable, and real-time predictive analysis of conversational data.
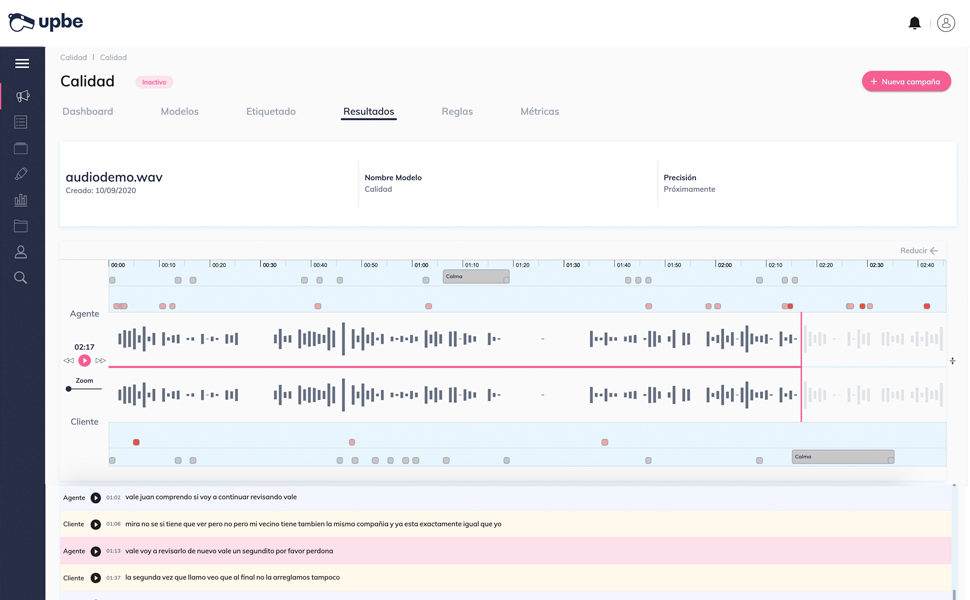
Conversational AI solutions like Upbe allow you to:
- Access more and better data: such as those related to your agents’ soft skills or their adherence to the sales pitch.
- Analyze 100% data samples: compared to the industry standard of 1%, this eliminates biases in the analysis and detects incidents more quickly.
- Understand your customers’ context: providing relevant data about the sentiment and situationality of calls, such as silences, tones, accents, etc.
This exhaustive analysis is what opens the door to optimizing key indicators for the survival of the contact center, such as FCR, AHT, churn, or service level.
Imagine discovering that your customers need to make several calls to know the status of a procedure, and that this causes 12% of complaints. That’s what happened to one of our clients who realized that an automated SMS would save them a good number of calls.
And all thanks to data. The 4% improvement in FCR resulted in additional revenue of €45,000 per year, as well as the obvious improvement in customer satisfaction and agent productivity.
In other words, AI provides differential value in the call center by automating the monitoring of qualitative parameters, sales verification, and scalable analysis of complete samples: exhaustive, contextualized, and unbiased data.
In short: precise and early detection of any incident that may affect objectives and a much more real vision of the direction in which the business is moving.
Do you think you can optimize the way you measure your call center’s indicators? Request a demo and we’ll explain how artificial intelligence can help you monitor, audit, analyze, and improve your agents’ performance.


6 Comments
Comments are closed.